Global Warming Myths: Bogus Science and Exaggerated
Claims for Climate Change

Introduction
I get many questions about the science behind the global warming controversy. It seems that many conservatives feel compelled to deny the connection between global warming and greenhouse gases (although one would be hard-pressed to find anyone who would deny that carbon dioxide and methane are greenhouse gases that are increasing rapidly in our atmosphere). Global warming deniers often cite data that is skewed or even false in order to support their claims. Radical environmentalists exaggerate claims to promote their political agendas. This page is an attempt to address some standard myths that have arisen among those who deny or exaggerate how humans are responsible for earth's warming temperatures. As with the main global warming page, all the original data is cited and presented so that you can confirm the validity of the science.
Sunspot activity causes global warming?
Figure 1. Sunspot activity compared to global
temperatures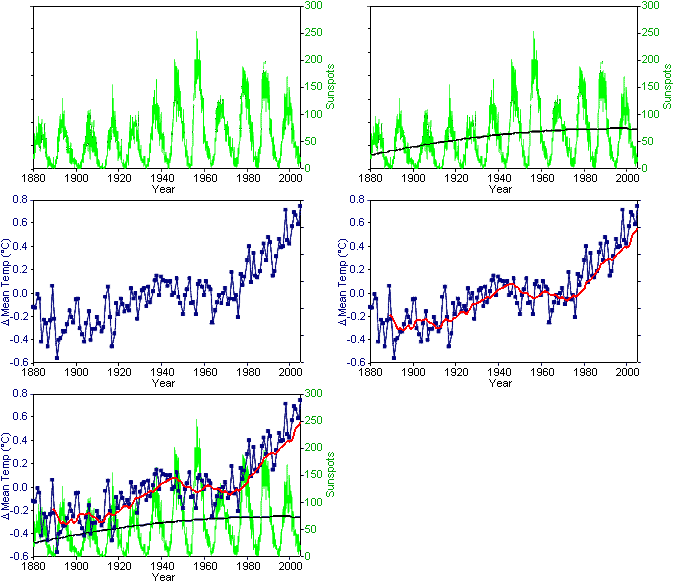 Sunspot data from National Oceanic & Atmospheric Administration (National Geophysical Data Center) (Original Data Global Temperature data from GISS Surface Temperature Analysis2 (Original Data |
Rodney Viereck, NOAA Space Environment Center, brought up an idea that sea surface temperature (SST)
correlated with sunspot number.1 However, the data just didn't seem quite
right. Since sunspots cycle over
a short period (ten years), it seemed that Mr. Viereck had used some really
bad data. So I downloaded the sunspots data for the entire
period of 1880 to 2006. This is what it looks like (global surface
temperatures in blue and sunspots in green). The "correlation" obviously
disappears when one examines the data. Although the number of sunspots has
risen, the number has remained constant since 1960, the period in which global
temperatures have risen the most. Obviously, the correlation doesn't really hold
up.
Gamma cosmic rays (GCR) cause global warming?
Figure 2. Gamma cosmic rays compared to global
temperatures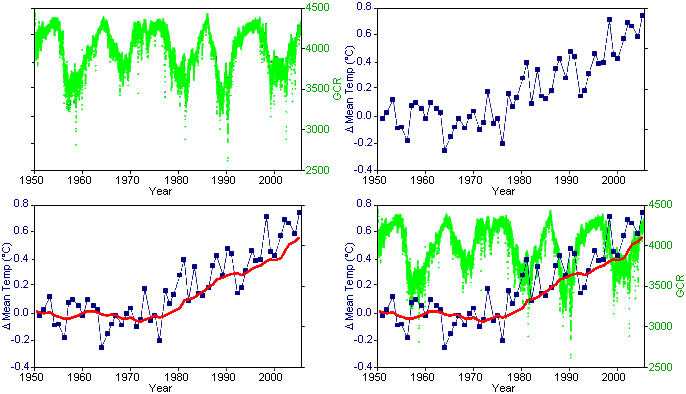 GCR data from The Cosmic Ray Overview (University of New Hampshire) (Original Data Global Temperature data from GISS Surface Temperature Analysis2 (Original Data |
Danish researchers Henrik Svensmark and Eigil Friis-Christensen have demonstrated that cosmic rays can cause cloud cover to vary as much as 2% within a period of 5 years. This produces a change in the heating of the earth's surface by up to 1.2 W/m2. The claim is that since, the IPCC has estimated that CO2 emissions since the Industrial Revolution have caused an increase of 1.6 W/m2,2 it is possible that cosmic rays have accounted for 75% of global warming. The problem is that the latest Svensmark and Friis-Christensen data contradicted much of their earlier work. Like the sunspot data, when the data is plotted over many decades, the trend disappears quite well. Of course, solar activity and GCR do impact climate in the short term (over their 10 year cycles). The problem is that there are no long term trends for either, whereas there are long term trends for climate.
A more recent study examined the effects of cosmic rays on the "ion-aerosol clear-air" hypothesis, which suggests that increased cosmic rays cause increases in new-particle formation, cloud condensation nuclei concentrations (CCN), and cloud cover. However, the new paper showed that the magnitude of the ion-aerosol clear-air mechanism was two orders of magnitude too small to account for the observed changes in cloud properties,3 demonstrating that it could not be the cause of the current global warming trend.
Volcanoes produce more carbon dioxide than all carbon emissions produced by humans
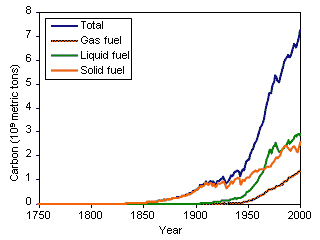
The claim is that volcanic action around the world in one day spews forth more greenhouse gases than all of man's activities in one year. The claim is completely false. In fact, all the volcanic activity over the entire world for one entire year emits 130-230 teragrams carbon dioxide (http://en.wikipedia.org/wiki/Volcano). In contrast, human activities produce over 7000 teragrams/year (1 petragram=1000 tergrams) (See Figure 3, right). So, volcanoes emit only 3% the amount that humans do. In fact, human activity exceed that of volcanic activity early in the Industrial Revolution (by 1870).
Volcanic Versus Anthropogenic Carbon Dioxide, Eos (2011) 92: 201-208.
Urban heat island effects account for global warming
Many skeptics claim that the location of temperature measuring stations
near cities results in readings that are artificially inflated from the real
temperature measurements. This problem is known as urban heat island effects. These
effects are real but local, and have a negligible influence (less than
0.006°C per decade over land and zero over the oceans)4 on
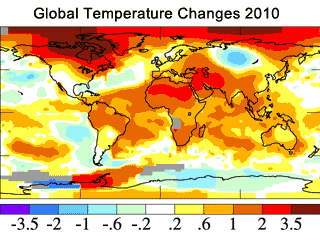
global temperature values. In addition, the largest changes in global
temperatures have been recorded north of 60° latitude, where there are
no large cities at all (Figure 4).
Global warming will result in a sea level rise of 9 feet this century
Figure 5. Changes in Sea Level
Relative to Global Temperatures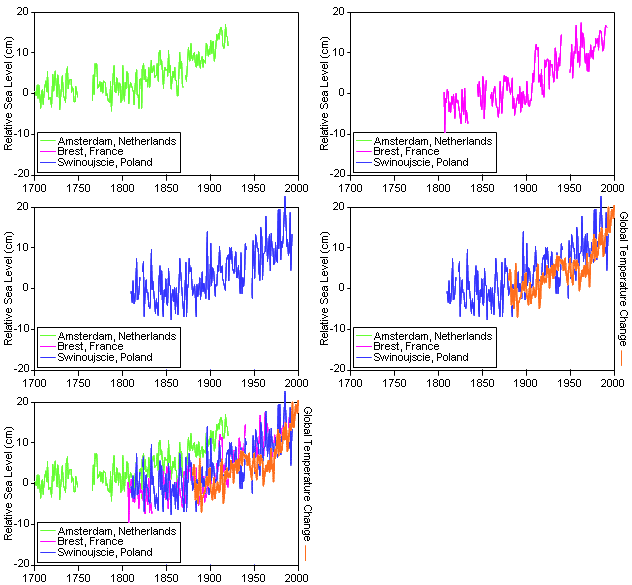 Adapted from IPCC SYR Figure 2-5 |
The IPCC WGI Fourth Assessment Report indicates an observed sea level
rise of 0.18 m (7 in) per century for the period of 1960-2003. However, the
rate is increasing rapidly, such that the rate for the last ten years of the
period are nearly double (0.31 m/century). The IPCC puts the projected sea
level rise for the 21st century at 0.26 – 0.59 m (10-18 in). Sea levels have
risen 0.2 m (8 in) in the last 150 years (Figure 5).
Global warming will result in increased temperatures of 9°C
The IPCC WGI Fourth Assessment Report puts the amount of temperature increase at 1.8°C/century if global carbon dioxide concentrations remain at year 2000 levels (extremely unlikely). If fossil fuel usage increases dramatically (probably also unlikely), the projected increase would be 4.0°C/century. The most likely value would be 2-3°C, most of which would occur in high latitudes and/or during the winter months.
Global Warming has stopped since temperatures have been stable for several years
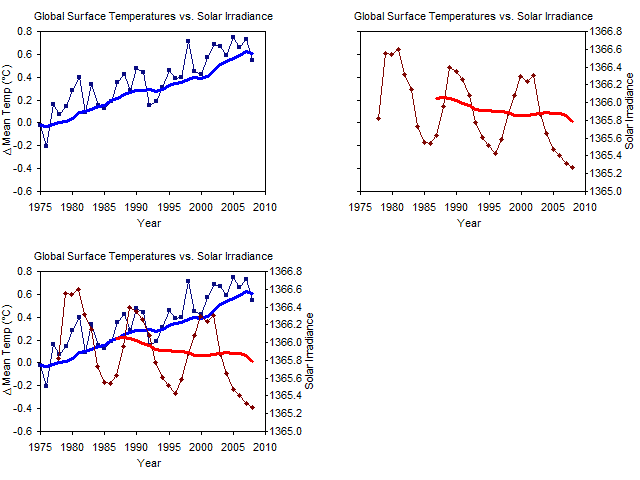
Although surface temperatures have risen rapidly in the last 100 years, in the last 8 years, temperatures have leveled off. Does this mean that global warming has stopped? The past temperature recordings have shown global warming occurs in spurts, with periods of little or no change for up to 30 years. The fact that temperatures have not risen rapidly in the last 8 years is not unexpected, since we are currently at the lowest point in the Sun's luminosity cycle (Figure 6).3 The figure shows that surface temperatures have generally peaked near solar irradiance peaks and have leveled off during solar irradiance troughs. It is also interesting to note that the overall trend is for decreasing solar irradiance during a time of increasing temperatures. It's a good thing solar irradiance is not increasing during this time!
Conclusion 
 Many myths surround climate change science. The fact that climate change
has become a political issue has not helped matters. As conservatives and
liberals tend to line up at the extremes and promote their own hype, the
voice of reason and science tends to be drowned out. At this point, it seems
very unlikely that a natural cause is behind our world's increasing
temperatures. Even so, the scare tactics of radical environmentalists and
liberal politicians does nothing to prioritize our response to global
warming.
Help us add to this page
If you are a global warming skeptic or radical environmentalist, send in your best ideas so I can research the data to present on this page. Please e-mail your suggestions to Rich Deem. Don't worry, your name and/or email address will never be revealed. Please see our Privacy Policy for more information.
Related Pages 
- Global Warming: Will Human-Induced Climate Change Destroy the World?
- Global Warming: Deceptive Article in Los Angeles Times - Oops! We forgot to tell you the real data!
- Is Christianity anti-Environmental?
-
 Book
Review: Should Christians be Environmentalists?
References 
- Rodney Viereck, NOAA Space Environment Center, The Sun-Climate Connection (Did Sunspots Sink the Titanic?)
- Climate Change 2007: The Physical Science Basis (Chapter 2 Changes in Atmospheric Constituents and in Radiative Forcing) from the Intergovernmental Panel on Climate Change
-
Total Solar Irradiance from NOAA (Original Data
 ),
updated April, 2009.
 - Pierce, J. R., and P. J. Adams. 2009. Can cosmic rays affect cloud condensation nuclei by altering new particle formation rates? Geophys. Res. Lett. 36: L09820, doi:10.1029/2009GL037946.
http://www.godandscience.org/apologetics/global_warming_myths.html
Last updated June 15, 2011
